 Here in Texas, it’s back to school time and at So Many Stadiums, we’ve joined in. No column this week, but some good old fashioned Venn diagrams. Last week I compared my schedule to the SI season tour. This week, I have a different perspective on my upcoming season. The first chart compares the SI and AP top twenty-five preseason polls. I only pick up four teams, all which made both lists. Not too encouraging, but given that the margin of error is probably about five teams, it might be better than it actually looks.
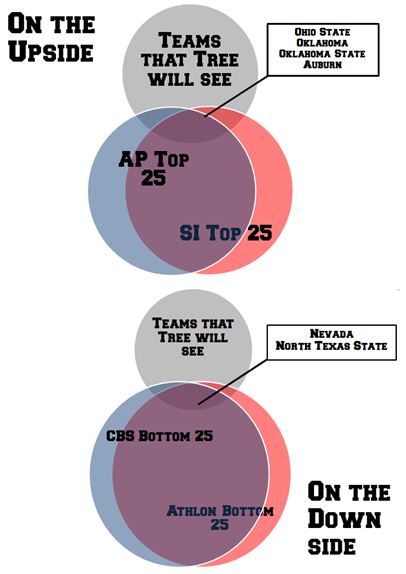
Even better, a comparison of CBS’s and Afthlon’s Bottom twenty-five shows that I am only slated to see two of the worst teams of the country. Given that the two polls only differ by two teams, the margin of error is probably a little lower than the top twenty-five. If my work schedule and the weather forecast cooperate, it could be a pretty good year.